
JUICE THE BLUEBERRY
What We Get Wrong About Risk
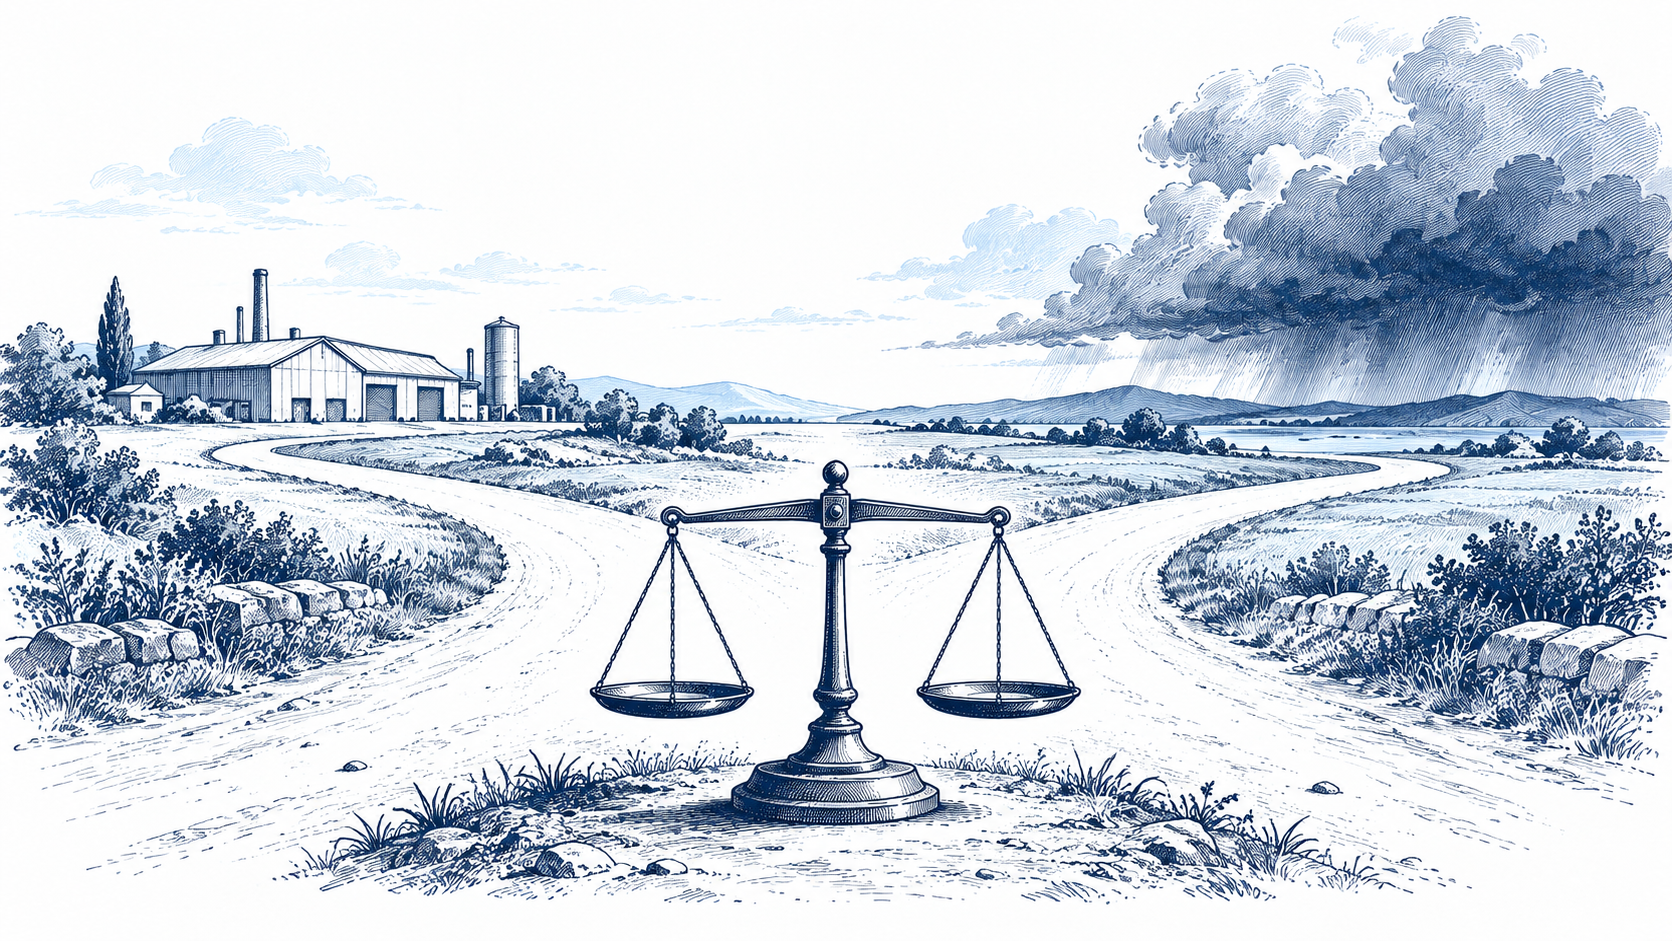
Counts tell us where harm occurs. Rates help us compare exposure.
Imagine seeing two workplace injury headlines: one industry recorded more deaths; another had the higher fatality rate. Which job is riskier? The answer depends on the question. A count identifies the larger total burden. A rate divides fatalities by the number of full-time-equivalent workers, making differently sized groups more comparable.
The Bureau of Labor Statistics counted 1,391 fatal work injuries in transportation and material-moving occupations in 2024. Its corresponding rate was 12.5 per 100,000 full-time-equivalent workers. The rate for civilian workers overall was 3.3. These figures support a narrower statement than “transportation is dangerous”: the defined occupational group had a substantially higher measured fatal injury rate in that year. They do not describe every worker's personal risk or include every form of illness and long-term harm.
Risk judgments also change with the denominator. A safety manager deciding where to direct prevention resources might start with total cases. A worker comparing occupations may care about a rate. A household considering a particular trip needs exposure by miles, hours, or journeys, not an occupational statistic. Mixing those measures creates dramatic but misleading comparisons.
Our test for a risk claim is simple: name the event, the population, the time period, the exposure unit, and the uncertainty. Then ask whether the intervention would reduce the rate, the total number harmed, or both. Better measurement does not make a difficult choice easy, but it stops a vivid anecdote from masquerading as the whole picture.
Sources: BLS 2024 fatal occupational injuries; BLS occupational counts and rates.